
A channel partner in Pune messaged me last month. He’d listed three plots in different suburbs — all priced similarly, all around 1,200 square feet. One sold in 11 days. The other two are still sitting there after 73 days. The difference? The first plot was in an emerging metro corridor zone. The other two were in areas people already considered “developed.”
That’s the thing about property appreciation zones. Timing beats location every single time.
You don’t want property where prices already peaked. You want land where the growth story is just starting — where infrastructure announcements are fresh, where developers haven’t flooded the market yet, where locals still think it’s “too far out.” That window closes faster than most plot investors realize.
This isn’t about guessing. It’s about reading signals that most people miss because they’re looking at the wrong things. Here’s how you actually identify high-growth property appreciation zones before everyone else catches on.
Why Most Investors Miss the Best Appreciation Zones
Here’s what happens. Someone hears about a “hot location” from a broker. They visit on a weekend. The area looks decent. There’s a mall nearby, maybe a new road. They buy.
Three years later, appreciation is flat. Maybe 4% annually if they’re lucky.
The problem wasn’t the area. It was the timing. They bought after the announcement, after the initial price jump, after the early movers already made their money. They bought visibility, not potential.
Real appreciation zones reveal themselves through infrastructure plans that haven’t materialized yet, through government land acquisitions that signal intent, through rezoning notifications that most people scroll past. You’re looking for areas where the story is forming — not where it’s already being told.
I’ve watched this play out across multiple cities. Tambaram in Chennai appreciated 47% between 2023 and 2026 once the metro extension was confirmed. But the people who made real money bought two years before construction started — when the route was still being debated in planning documents. By the time photos of station construction hit social media, the opportunity was gone.
Search properties in emerging zones on Freeperty, and you’ll notice something interesting. The listings with the longest descriptions and most detailed infrastructure mentions? Those are usually from brokers who understand appreciation timing. The vague listings? Those are people hoping location alone does the work.
The Four-Signal Framework for Spotting Growth Zones
Forget the noise. There are four signals that consistently predict property appreciation zones across India. Miss even one, and you’re gambling instead of investing.
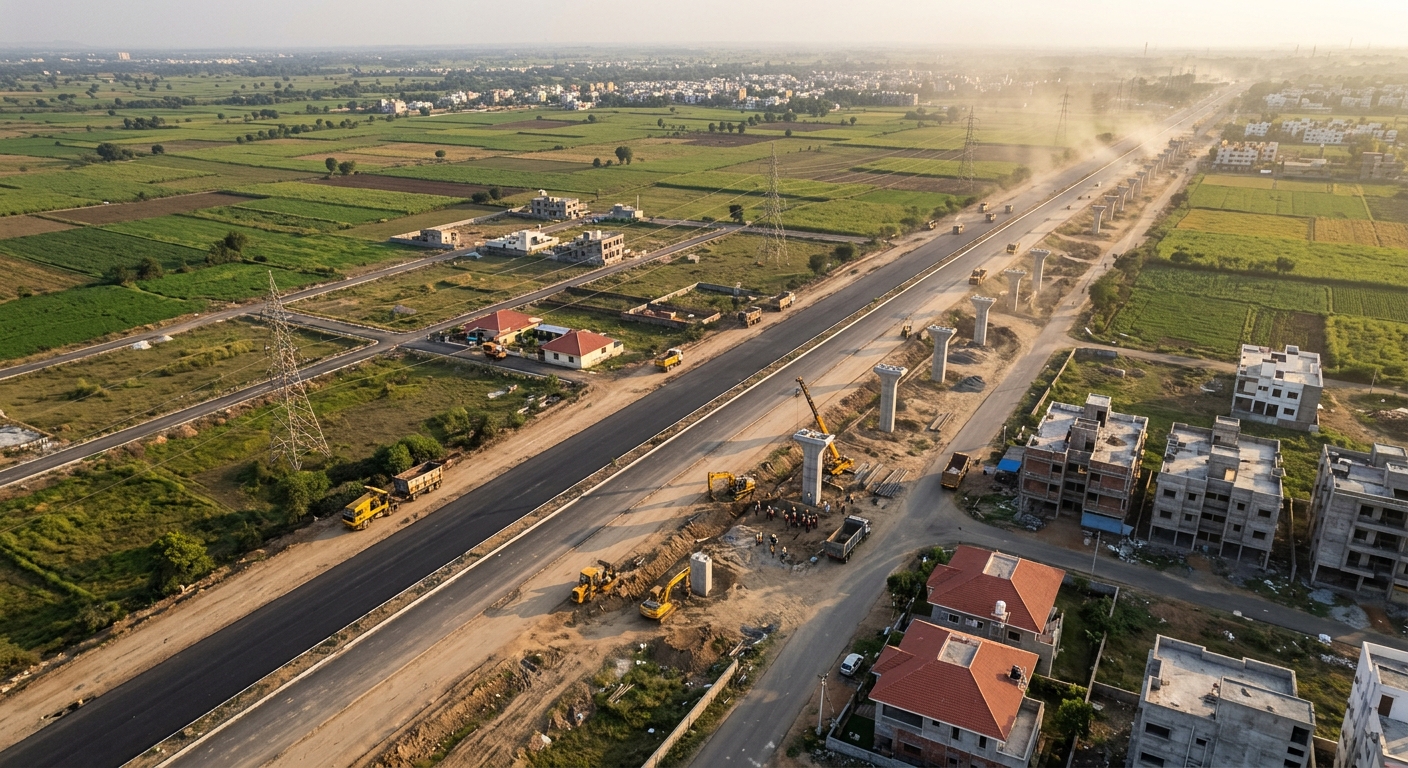
Signal one: Connectivity under construction. Not planned. Not proposed. Actually under construction with visible progress. Metro lines being laid. Highway widening with equipment on-site. Rail corridor extensions where land acquisition is complete. These create forced appreciation because the timeline is certain.
Signal two: Institutional clustering. When three or more large institutions — IT parks, universities, hospitals, manufacturing units — announce locations within a 5-kilometer radius, residential demand follows within 18 to 24 months. This isn’t theory. It’s pattern recognition from watching Whitefield, Hinjewadi, and Siruseri develop over the last decade.
Signal three: Price asymmetry with adjacent areas. If an emerging location is priced 60% lower than an established area just 4 kilometers away, and both have similar connectivity timelines, that’s not a discount. That’s a temporary gap. The market corrects these asymmetries faster than people expect.
Signal four: Fragmented ownership with low developer inventory. Areas where land is still held by individual owners and farmers — not aggregated by large builders yet — offer better appreciation potential. Once developers dominate, they control supply and pace price increases to match their project timelines. Individual sellers react to market demand faster.
Apply all four filters, and you’re left with maybe 3 to 5 zones per city per year. That’s exactly the point. High-growth property appreciation zones are rare, not abundant.
Reading Infrastructure Announcements Like an Insider
Most people read infrastructure announcements wrong. They react to headlines. Smart investors read gazette notifications.
When a state government publishes a detailed project report for a new expressway, that document tells you everything. The exact route. The village coordinates. The timeline. The budget allocation stage. You can map the corridor before a single broker pitches it.
Same with metro extensions. The moment a route gets environmental clearance — not approval, just clearance — you know construction will start within 9 to 14 months. That’s your window.
I saw this happen in Nagpur with the metro phase two extension toward MIHAN. The DPR was published in August 2024. Most people ignored it because the route wasn’t finalized. By December, land prices along the proposed corridor had jumped 22%. By the time the route was officially announced in March 2025, early buyers had already locked in their gains.
Infrastructure development cycles follow predictable patterns. Announcement. DPR. Environmental clearance. Land acquisition. Tender. Construction. Each stage creates a price jump. But the biggest gains happen between DPR and land acquisition — when information is public but attention is still low.
Check your state’s urban development authority website every month. Most publish detailed project timelines that never make it to news sites. That’s where property appreciation zones announce themselves before anyone’s paying attention.
How Population Migration Patterns Reveal Hidden Hotspots
Forget where people live now. Look at where they’re moving.
India’s internal migration data shows something interesting. Tier-two cities aren’t just growing — they’re pulling specific demographics. Young professionals moving for jobs. Retirees relocating from metros for lower costs. NRIs buying second homes in ancestral regions now that infrastructure improved.
Each migration type creates different appreciation patterns. Job-driven migration? Look for rental demand zones near employment hubs. Retirement migration? Focus on low-density residential areas with hospitals nearby. NRI-driven demand? Coastal regions and hill stations with improved connectivity.
Coimbatore saw this exact pattern. Between 2023 and 2026, the city absorbed 31,000 new IT professionals as companies opened delivery centers there. The areas that appreciated fastest weren’t in the city center. They were 8 to 12 kilometers out along the new ring road — where young buyers could afford standalone plots and build gradually.
Track job postings, not just company announcements. When you see 200+ openings for a single company in a tier-two city on LinkedIn, residential demand follows within six months. That’s a leading indicator most investors completely miss.
Use this for property appreciation zones across India. High-growth areas follow people, and people follow jobs, schools, and lifestyle infrastructure — in that order.
The Due Diligence Checklist Developers Don’t Want You Using
You’ve identified a potential zone. Now verify it won’t turn into a five-year mistake.
Pull the master plan. Not the promotional version from a builder’s website. The actual municipal master plan from the urban development authority. Check the land use designation. Is it residential, or is it still marked agricultural with a “proposed residential” tag? That distinction matters because financing and resale both become complicated if the rezoning isn’t complete.
Check water table data. The Central Ground Water Board publishes this publicly. If an area is in the “over-exploited” category, long-term residential desirability drops regardless of infrastructure. Buyers will hesitate. Banks will question. Appreciation slows.
Verify legal access. A plot might be near a highway, but if there’s no legal approach road recorded in the revenue records, you’re buying future litigation, not future appreciation.
Look at actual transaction data, not listing prices. Sites like Freeperty’s property discovery platform show real listings from owners, brokers, and developers — which gives you a range. But for closed transactions, check sub-registrar office records. In Karnataka and Maharashtra, these are digitized. You can see what plots actually sold for, not what they were advertised at. The gap tells you if a zone is genuinely heating up or just experiencing listing inflation.
One builder in Hyderabad learned this the hard way. Bought 40 acres in a “high-growth zone” based on a consultant’s report. Turned out the area had pending litigation on land acquisition from a decade-old highway project. It took three years and legal fees exceeding ₹1.2 crore to clear. His IRR? Negative.
Micro-Markets vs. Macro Zones: Where Real Money Gets Made
Property appreciation zones aren’t uniform. Within every high-growth area, there are micro-pockets that outperform by 2x or 3x.
Take Sarjapur Road in Bangalore. Everyone knows it’s a growth corridor. But the stretch between Carmelaram and Dommasandra appreciated 64% between 2024 and 2026, while the stretch closer to the Outer Ring Road did 31% in the same period. Why? The outer stretch had metro plans plus lower density. The inner stretch was already saturated.
This is micro-market analysis. You’re not just picking a zone. You’re picking the exact 2-kilometer stretch within that zone where supply-demand dynamics are most favorable.
Look for areas where plot sizes are still flexible — 1,200 to 2,400 square feet — rather than locked into 600-square-foot builder plots. That flexibility attracts a wider buyer pool, which creates liquidity, which drives appreciation.
Avoid areas where a single large developer controls 70% of available inventory. They’ll release plots in phases, artificially controlling price increases. You want fragmented ownership where market forces — not builder strategies — set the pace.
Freeperty’s platform is useful here because every listing becomes a searchable landing page. You can filter by exact localities, compare price trends within a 3-kilometer radius, and spot the micro-markets where pricing hasn’t caught up to macro-zone momentum yet.
The Exit Strategy Nobody Talks About During Entry
Here’s the uncomfortable question. When will you actually be able to sell?
Appreciation on paper means nothing if there’s no buyer pool when you’re ready to exit. The best property appreciation zones aren’t just areas where prices rise. They’re areas where liquidity remains high throughout the growth cycle.
That means end-user demand, not just investor speculation. It means areas where people actually want to live, not just flip. It means plots that qualify for home loans, not just cash deals.
Before you buy, check three things. One: Are there finished homes in the area, or just empty plots? If it’s all plots, you’re in a speculator zone. Appreciation might happen, but exit will be slow. Two: Do local banks approve loans for that micro-market? Call two or three banks and ask directly. Some emerging zones get blacklisted due to title issues or litigation history. Three: Is there rental activity? Even for plots, nearby rental demand signals that people want to live there — which means future buyers will have the same intent.
I watched an investor sit on a plot in an “emerging zone” near Pune for four years. Appreciated 38% on paper. Couldn’t find a buyer willing to close. Why? The area never developed end-user demand. It was all investors waiting for other investors. When the music stopped, everyone was holding property nobody wanted at those prices.
Plan your exit during entry. That’s the difference between property appreciation zones and appreciation traps.
What Freeperty’s Data Tells Us About 2026 Hotspots
At Freeperty, we’re seeing search and listing patterns shift in real time. Certain areas are getting discovery traffic months before brokers flood in.
Right now, tier-two cities are dominating search interest. Coimbatore. Visakhapatnam. Nashik. Bhubaneswar. People aren’t just browsing. They’re comparing multiple listings in the same locality, downloading property details, and returning to the platform within 48 hours. That behavior signals intent, not curiosity.
Within metros, peripheral corridors with metro construction timelines between 2026 and 2028 are seeing listing activity pick up. Sellers — especially individual owners — are moving faster than developers to capture early demand. That’s creating price discovery in real time.
Channel partners listing on Freeperty are also getting more specific with property descriptions. They’re mentioning distance to upcoming metro stations, naming infrastructure projects by official designation, and including government notification references. That level of detail wasn’t common even 18 months ago. It tells us the market is maturing. Buyers are asking harder questions.
If you’re evaluating property appreciation zones across India, watch where listing velocity increases but inventory hasn’t spiked yet. That imbalance — rising interest, constrained supply — creates the conditions for sustained appreciation. It’s not about where prices are high. It’s about where momentum is building and supply hasn’t responded yet.
Frequently Asked Questions
What are property appreciation zones and how do they differ from regular investment areas?
Property appreciation zones are locations where price growth is driven by upcoming infrastructure, demographic shifts, or policy changes — not current desirability. Regular investment areas are already established and appreciated. Appreciation zones are emerging, which means higher risk but significantly higher return potential if you time entry correctly.
How long does it typically take for an emerging zone to show measurable appreciation?
Expect 18 to 36 months from early-stage signals — like DPR publication or land acquisition — to visible price movement. Faster appreciation happens when multiple infrastructure projects converge in the same timeline. But if you’re buying after construction begins, you’ve likely missed 40% to 60% of the potential upside.
Which Indian cities currently have the highest number of identifiable appreciation zones in 2026?
Pune, Hyderabad, Coimbatore, Ahmedabad, and Bhubaneswar lead in verifiable high-growth corridors. Each has metro extensions, IT park expansions, or expressway projects with confirmed timelines. Tier-two cities generally offer better appreciation potential than metros right now because infrastructure gaps are larger and closing faster.
Can individual plot investors compete with large developers in identifying these zones early?
Yes, and often you have an advantage. Developers move slowly due to capital requirements and approval timelines. Individual investors can act on public information faster, buy smaller parcels in fragmented markets, and exit quicker. Use tools like Freeperty to monitor listing activity and price trends in real time — data that used to be accessible only to large players.
What’s the biggest mistake plot investors make when trying to identify appreciation zones?
Confusing activity with appreciation. Just because an area has new construction or broker buzz doesn’t mean prices will rise sustainably. Real appreciation comes from structural demand drivers — jobs, connectivity, institutions. Most investors buy stories instead of fundamentals, then wonder why appreciation stalls after an initial 10% bump.
Start Identifying High-Growth Zones With the Right Tools
Property appreciation zones don’t announce themselves with billboards. They reveal themselves through infrastructure documents, migration data, transaction patterns, and micro-market signals that most people scroll past.
You don’t need insider connections. You need systematic research and the discipline to act on data instead of hype.
If you’re serious about finding undervalued plots in emerging zones before prices spike, start by tracking listings and search activity on Freeperty. Every property becomes a discoverable page, which means you can spot momentum in specific localities before brokers flood the market. List your property for free or browse high-growth areas at [https://freeperty.com](https://freeperty.com). No fees. No subscriptions. Just transparent access to India’s fastest-growing property discovery marketplace.
Reach out if you’re a channel partner or owner sitting on inventory in an emerging corridor. The market’s moving faster than listing strategies from two years ago. Let’s make sure your property gets found.